Tools for Exploring Performance Patterns in Norwegian Folk Music
05 Apr 2024
•
max
•
audio
•
analysis
•
software
...
While researching thesis topics at the University of Oslo in 2020, I came in contact with The MIRAGE Research Project. Through cutting-edge music information retrieval (MIR) and machine learning, MIRAGE aims to build a comprehensive AI-based system for advanced music analysis to improve how computers listen and understand music.
For my thesis, I explored how we should design interactive computational tools to explore performance patterns in Hardanger fiddle music. My project was to build a MaxMSP toolkit with a variety of indiependent modules. The goal was that both musicians and reseachers would be able to use the tools, and that the software could facilitate a better understanding of the relationships between the rhythmical structuring and harmonic content of the music.
This post takes a quick look at some of the key features of my software toolkit developed for my master thesis. Link to a my full thesis at the bottom of the post.
Contents
What it is And How to Use it
At its core, the software tools can be used to explore the intricate relationships between high-level rhythmic patterns and motivic (harmonic) content in Hardanger fiddle music. Users can both visually explore these musical connections, through a dynamic UI, and create datasets from the many export options avaliable. There are also more active features included that allow stuff like realtime playback and novel editing possibilities.
For a brief and insightful overview of the basic usage, check out the video demonstration I made:
At the moment, the tools only support specific musical notation data (.csv) by the MIRAGE research group annotated directly from Hardanger fiddle performances. However, if you want to demo my tools, I added some example data in the GitHub repo of this project. Links at the bottom of the post. To start, open the first prototype and import some track data into the app.
Key Features
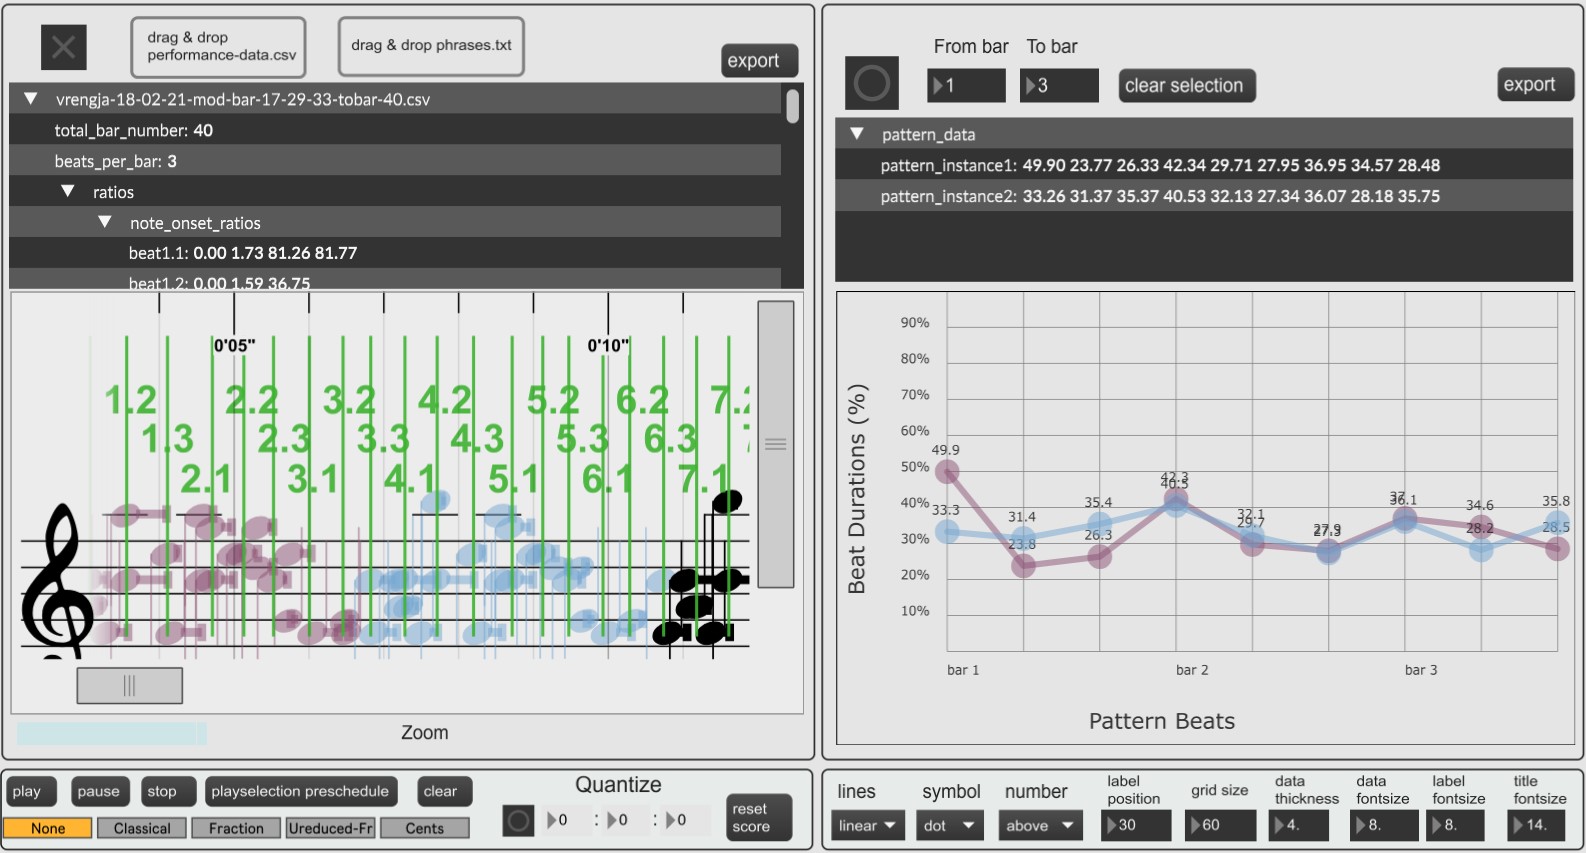
Although the tools include a wide variety of features, they can all be divided into two main categories, 1) a musical score representation with a dedicated data structure, and 2) a plotting interface for visual analysis.
Below are more detailed accounts of the main software features and export options.
Score Representation and Data Sturcture
The score is generated by feeding lists of performance parameters into the toolkit score representation from the overarching data structure. When importing the MIRAGE performance data, the information is first re-formatted into a clean dictionary data structure, as seen in the image below. This dictionary forms the basis for all toolkit operations and can readily be exported as a dataset on its own.
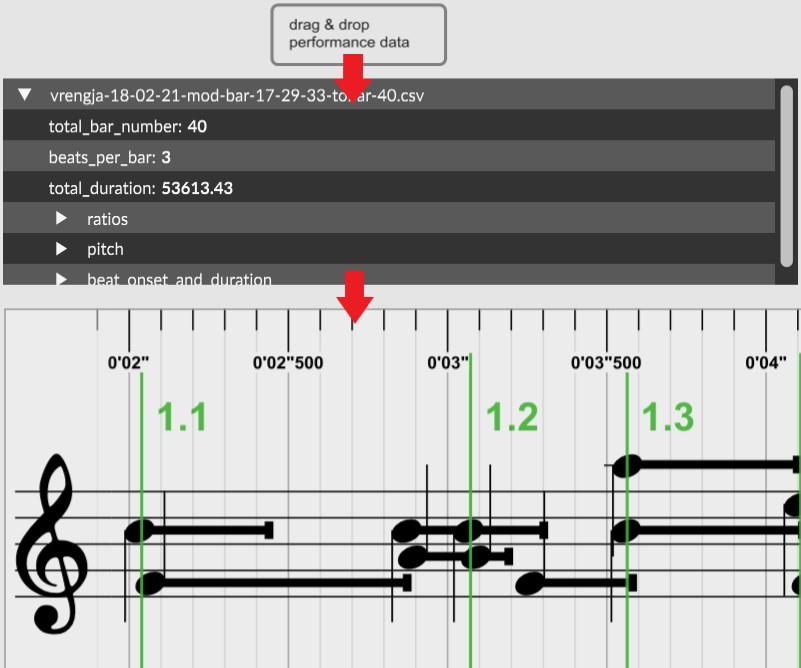
It was crucial that the score could provide detailed feedback about user gestures, such as mouse clicks and movements, as I wanted to explore several interactive features such as adaptive color-coding and beat-level manipulation. Because of this, I chose to build the score representation using the Bach library, specifically with the [bach.roll] piano roll object. With the Bach piano roll I could build a decent UI for editing, visualization and musical playback, based on proportional notation where each note is prescribed a horizontal spacing equal to its rhythmic duration. But most importantly, Bach roll sports a number of options that allow you to build highly interactive and very complex score representations.
Adjusting Beat Positions
The most interesting interactive component of the toolkit is its ability to adjust beat positions of the music. With beat-level editing, my goal was that both musicians and reseachers could use the software for comparison studies and other rhythmic investigations. But why? Long story short, Hardanger fiddle music is often in 3/4 measure and rhythmically structured in a way that the beats within the meausure all have uneven durations (Johansen 2017, Sevåg Sæta 1992). The uneven beats are far from random, part of intricate rhythmical categories sometimes refered to as timing patterns. These rhythms are unlike most other types of music and therefore very interesting to musicology research.
The beat positions in the toolkit score are indicated by the vertical green markers, each with a unique label that identifies the bar and beat number. As seen in the image below, users can adjust beat positions by moving the green markers left or right. When a beat position is adjusted, the relative distance between the beats changes while the relative distance between notes remains the same.
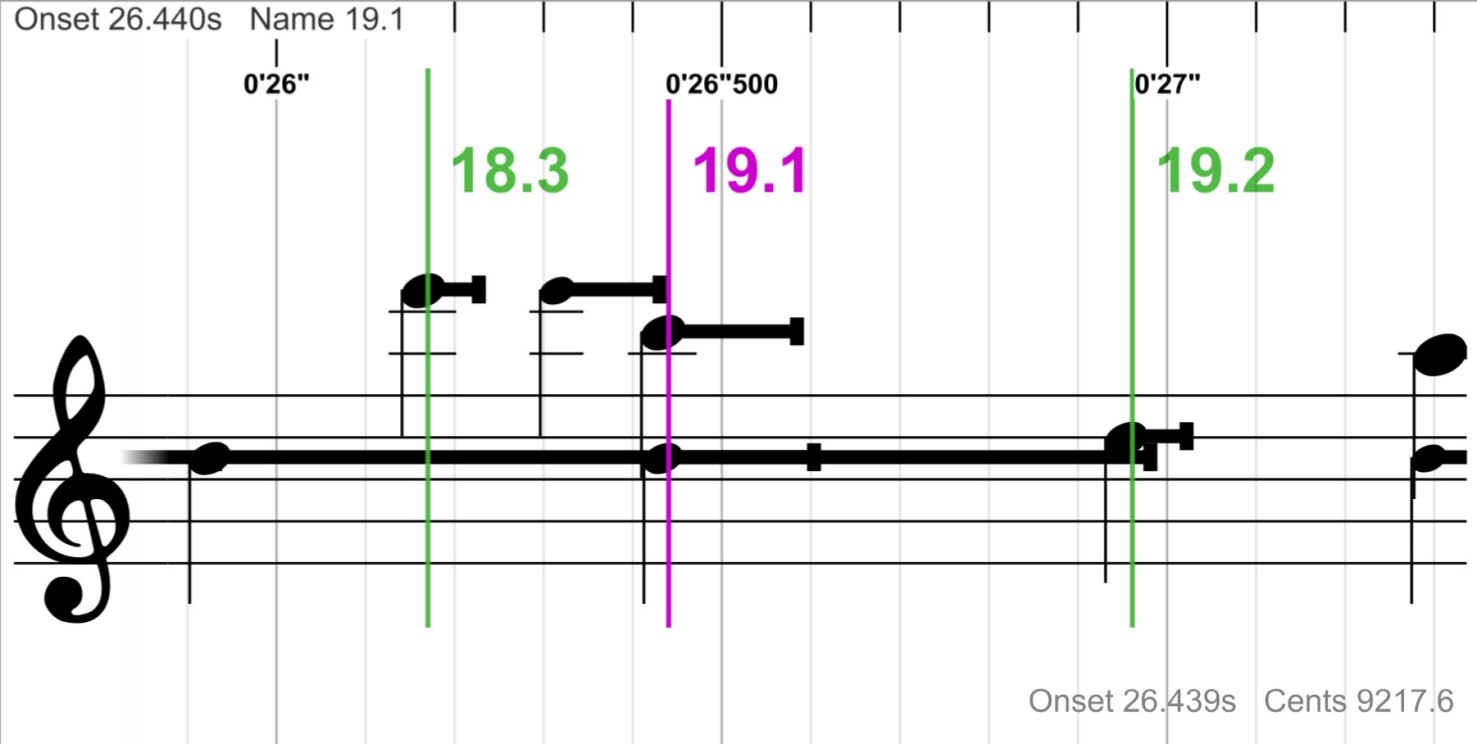
However, adjusting beat positions with this system causes neighboring beats to be made longer or shorter in response. In reality, the length of one beat does not usually affect neighboring beats like this (Johansson, 2010), so it was important to include additional options to let users decide how beat adjustments should be compensated for by neighboring beats and measures.
With my beat adjustment system in place, I continued to add more research-informed features and capabilities to my toolkit. Some of these installments were pretty novel, like the ability for users to artificially impose beat duration patterns onto the performance, detailed in the image below. Beat duration patterns occur when congruent beats consistently share the same durations/lengths. For instance, adopting a beat duration pattern of "10-40-50" means that the first beat is 10% long, the second beat is 40% long, and the third beat is 50% long, and that this is the case for every measure of the performance. As you can tell, the percentage duration of each measure always amounts to 100%. With a relative implementation like this, I am able to preserve the individual durational differences between each measure of the performance, only changing the relative lengths of the beats inside.
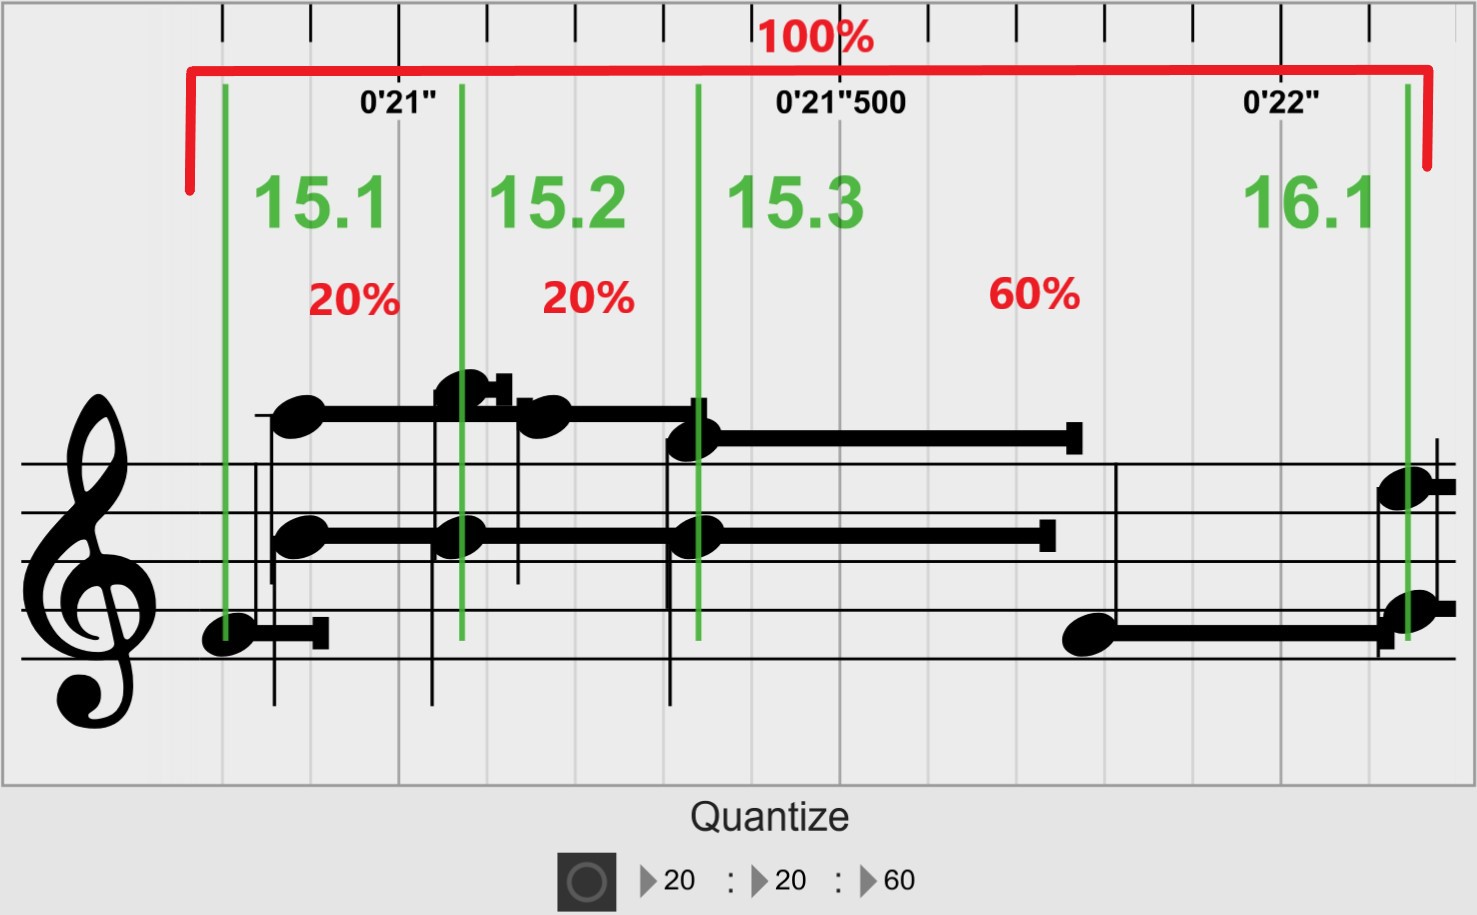
When adding this beat quantization feature, the idea was that it could be useful for folk music comparison studies and other rhythm-oriented muscology studies, but also for performers seeking to explore different timing patterns for their performance quickly and intuitively.
Visualizing Structural Relationships
Next to the score representaion in the UI, users will find one or more plotting windows. The plots are custom-made XY-graphs built with JavaScript and the [jsui] Max object that provide a fast and easy-to-use interface for insightful visual displays. These analysis modules work by referencing the toolkit data structure and sending information to the score window to acheive adaptive coloring and more. With the plots, users can compare timing patterns of different motivic segments of the performance and explore if regions with similar rhythmical propoerties share other parameters, such as pitch, velocity and metric position.
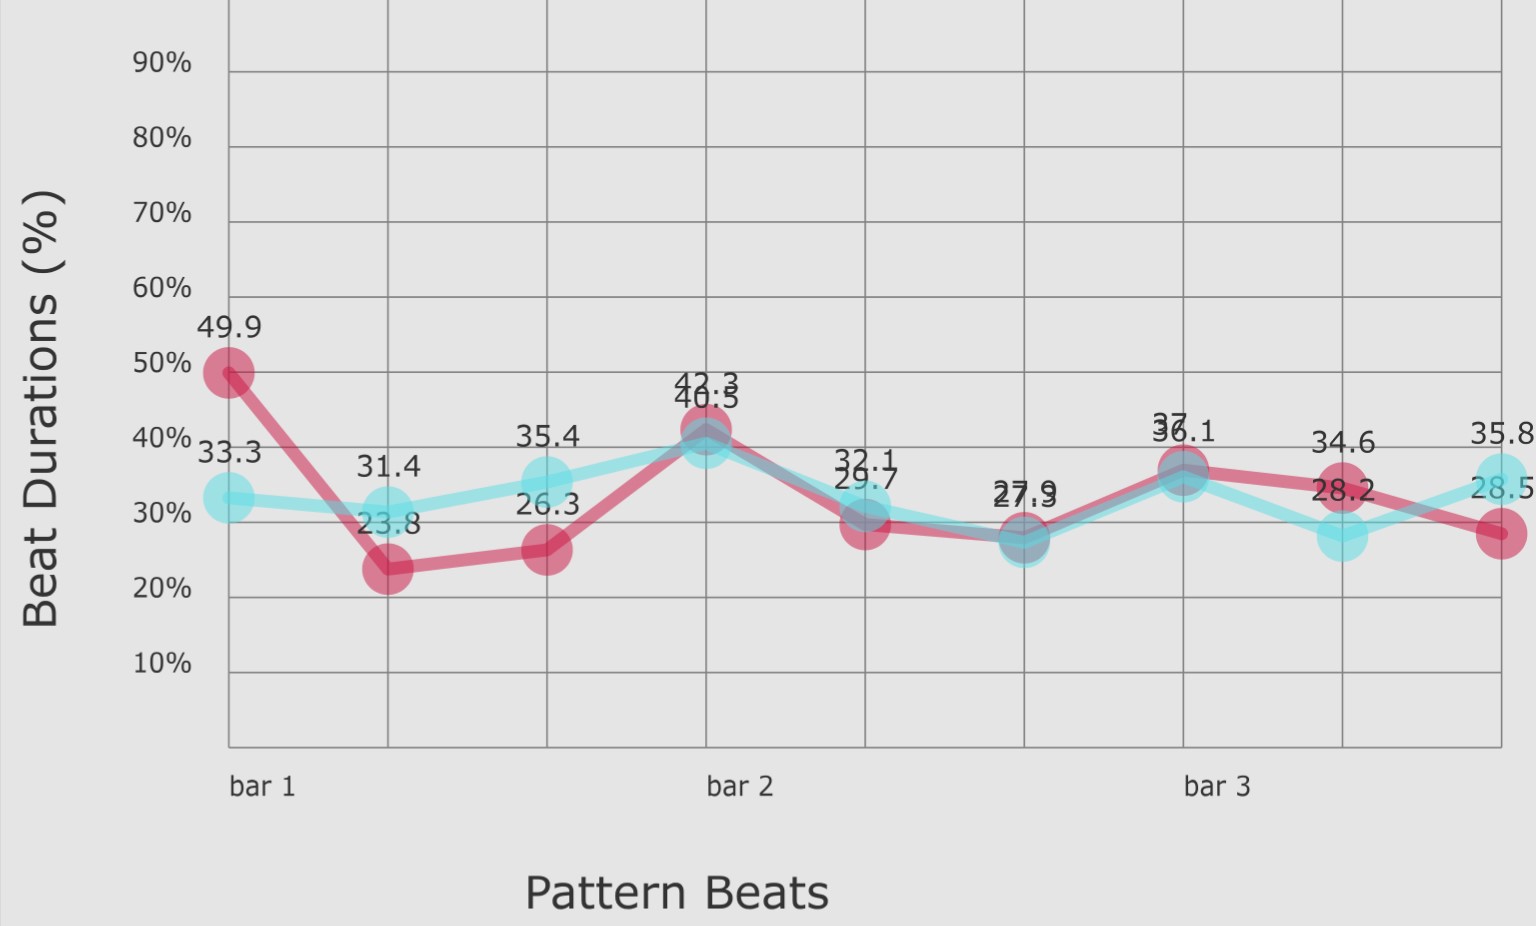
In the example below, a user is trying to examine the timing patterns of a recurring motif, a melodic segment that repeats at different times throughout the performance (Johansson, 2010). As seen, the motifs share similar timing patterns as they have similar beat duration distribution over time.
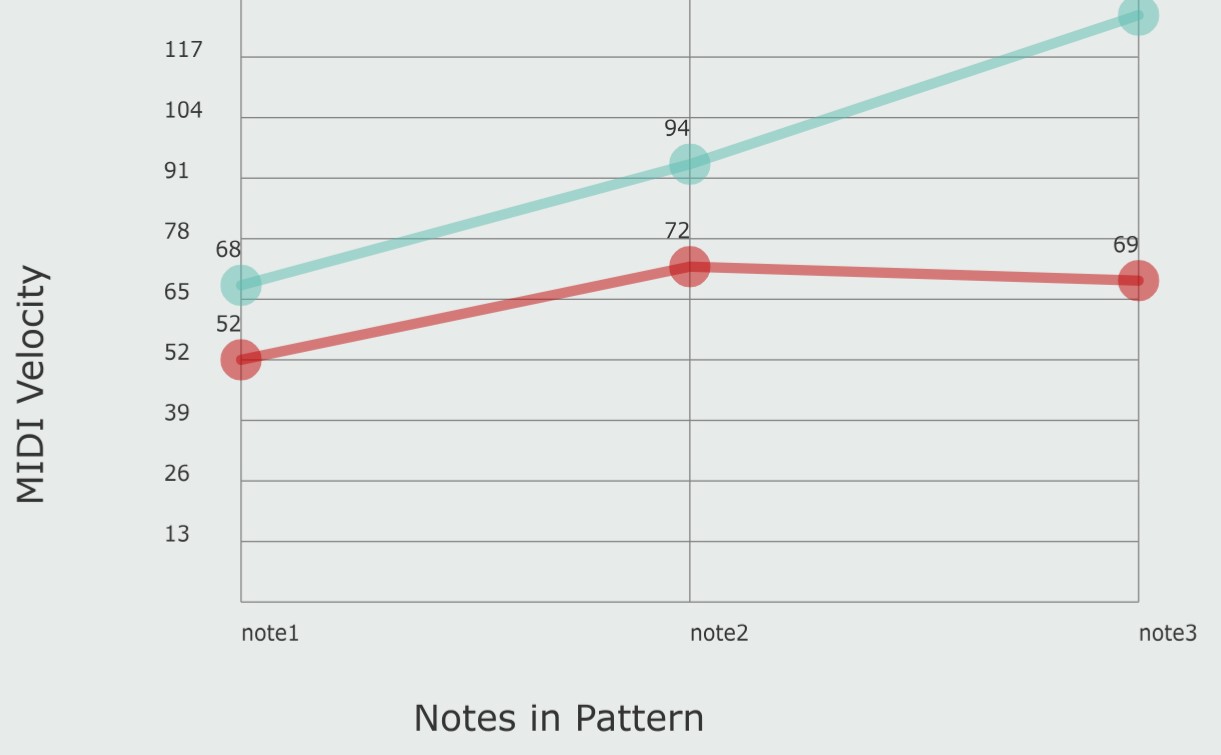
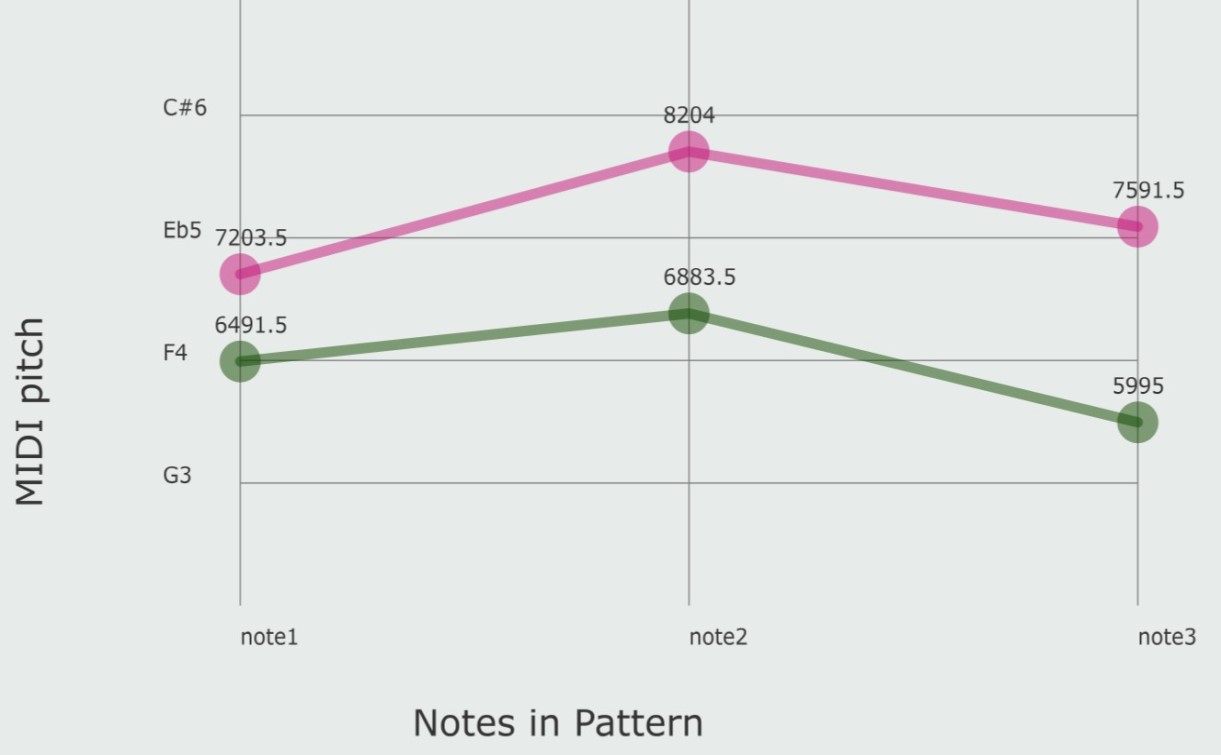
It's also possible to take a more multi-dimensional plotting approach with the tools and explore relationships between note regions that share similar rhythmic qualities. In the second example detailed below, a user has selected a custom note region in the score and the software has found a second region with a similar timing profile (note and beat durations). Now, the user can use the plotting window to investigate whether the two matching regions share other parameters as well, such as pitch, velocity and metric position of the notes.
Export Options
The toolkit data structure can be downloaded as a json file from the application menubar. In addition, all plots (with or without grid-lines) can be exported in a variety of uncompressed and compressed image formats. It is also possible to export the plotting data in a json file for more precise analysis and easy transport to other programming environments such as MatLab and Python.
Finally, the score itself can be exported as an 8-bit MIDI-file for playback.
Links and Resources
The software toolkit is open source and available on both OSX and WIN. The software can be downloaded from its own GitHub repo. I would like to thank my supervisors, Olivier Lartillot and Professor Mats Sigvard Johansson, for being involved in almost every aspect of this thesis, guiding the process from the very beginning.
Download and read my full thesis, Exploring Hardanger Fiddle Performance Patterns Through Interactive Computational Tools, from the Duo Research archives.
References
Johansson, M. (2017). Empirical Research on Asymmetrical Rhythms in Scandinavian Folk Music: A Critical Review. Studia Musicologica Norvegica, 43 (01), 58–89. doi: 10.18261/issn.1504-2960-2017-01-05
Johansson, M. (2010). The concept of rhythmic tolerance: Examining flexible grooves in scandinavian folk fiddling. In Musical Rhythm in the Age of Digital Reproduction. (pp. 69–84). Surrey, UK: Farnham, Ashgate.
Sevåg, R., & Sæta, O. (Eds.). (1992). Norsk folkemusikk. Serie II B. 2: Slåtter for vanlig fele Oppland : springleik - springar - springdans, marsj. Oslo: Scandinavian University Press. Retrieved from http://urn.nb.no/ URN:NBN:no-nb digibok 2013121005042