AudioVideoAnalysis - Realtime Spectral Analysis of Audio and Video
11 Nov 2022
•
software
•
audio
•
video
•
max
...
AudioVideoAnalysis a standalone application for realtime rendering of video motiongrams and audio spectrograms, one of the larger applications part of the Musical Gestures Toolbox for MaxMSP (MGT) created by Alexander Refsum Jensenius for the RITMO FourMS lab at the University of Oslo in the early 2000s.
In 2019, I was hired to update and refurbish AudioVideoAnalysis using Max 8. This post takes a quick look at fresh AudioVideoAnalysis v2.0 and shares some its key features.
How To Use It
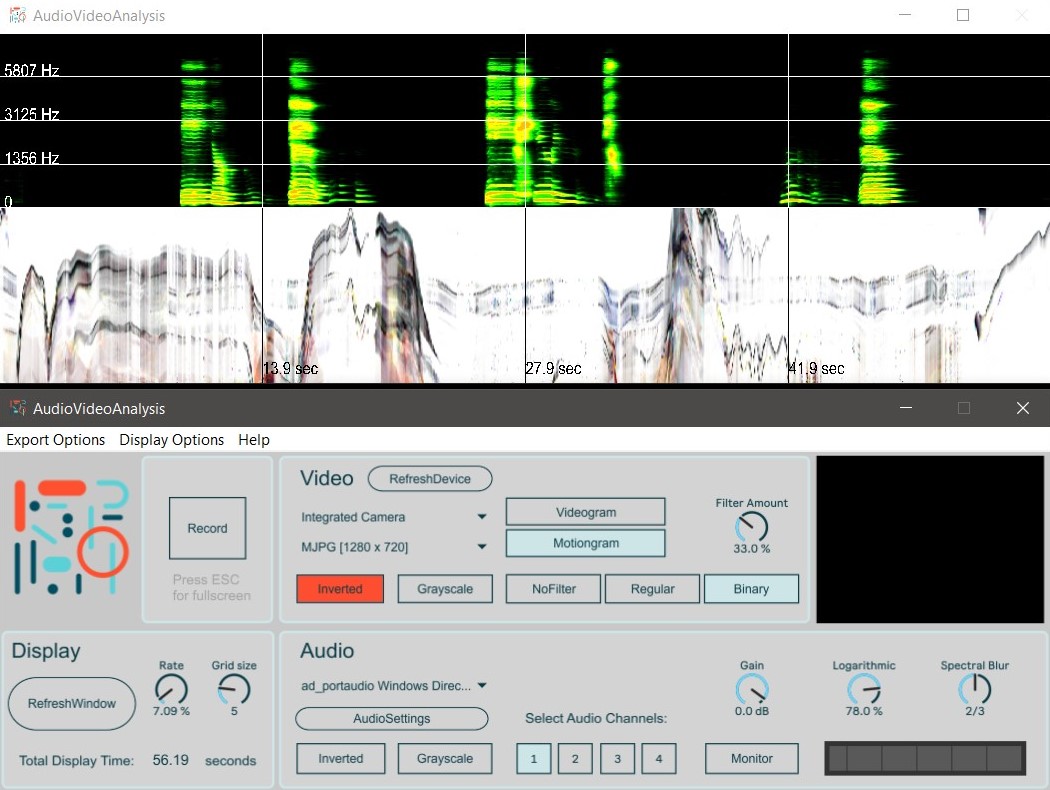
AudioVideoAnalysis (AVA) generates motiongrams, videograms (video), and spectrograms (audio) from any connected media source in real-time. Spectrograms are visual representations of the frequency spectrum of audio signals over time. Similarly, motion- and videograms are visual representations of motion in a video over time. We can call both of these representations spectral images.
To read more about motiongrams and how they're made, visit my previous post on the VideoAnalysis software. For documentation and guides on AudioVideoAnalysis, visit the official AVA Wiki. You can also get a detailed overview of all software operations from the app's help section.
Key Features
AVA sports many advanced audio, video, and display options. You can use multi-channel audio, apply inverted and grayscale colors, dynamically adjust frequency logarithms, apply filters, and more. Let's take a closer look at some of the interesting features of AudioVideoAnalysis v2.0.
Rate of Play
AVA works by printing images across the display window from left to right. By default, it takes 60 seconds for the images to loop back to start. However, there is a way to configure the speed of image printing.
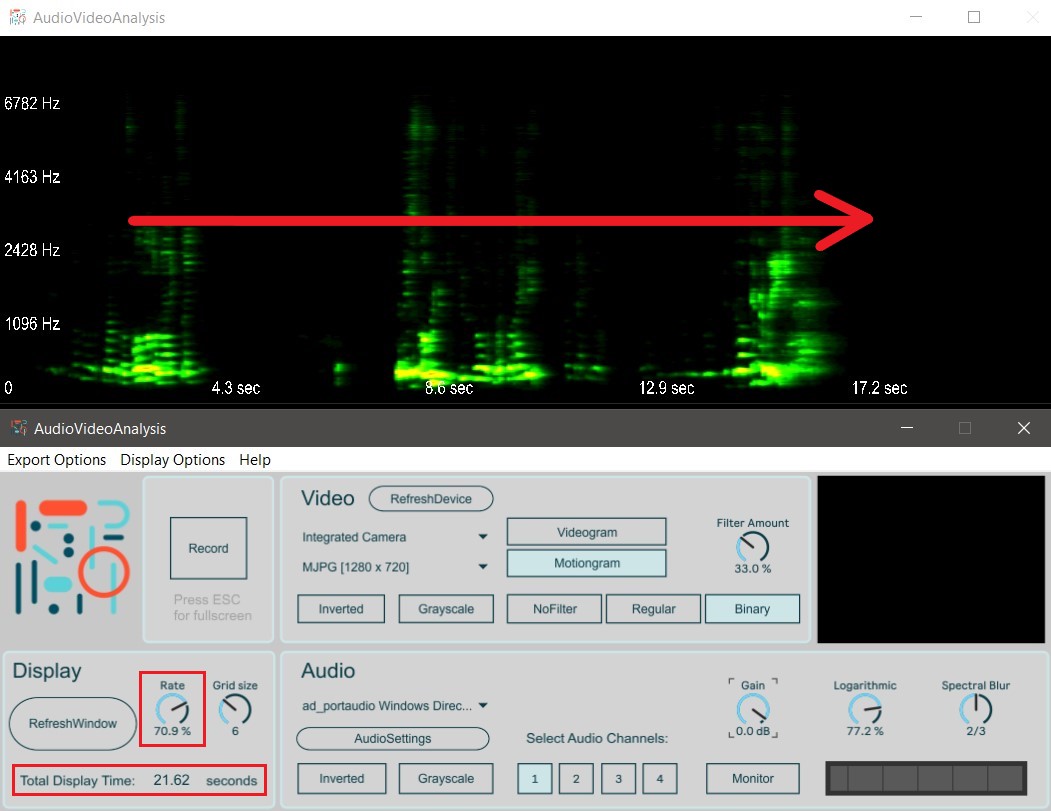
The printing rate determines how fast the images are printed across the display window. By adjusting the Rate dial while monitoring the Total Display Time in AVA's display settings, users can customize a desired speed that corresponds with the length of their recording.
A nice effect of increasing the printing rate is that it will increase the temporal resolution of the images, enabling you to zoom in on the spectral content. However, the downside of higher printing rates is that it decreases the overall image resolution.
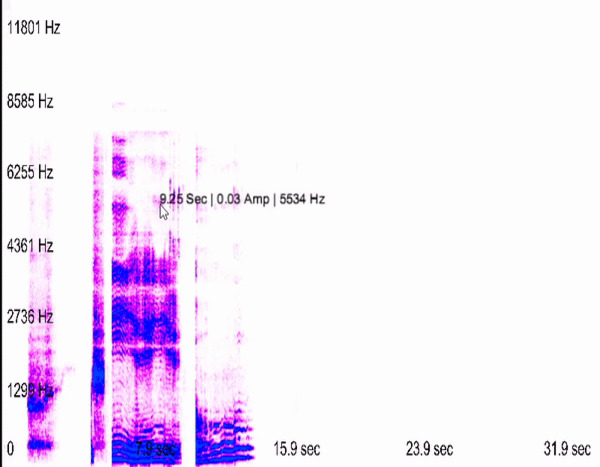
Analysis Markers
Perhaps the most useful feature of AVA is the ability to apply analysis markers and retrieve data from the display window. These features can help users to conduct some basic analysis immediately after recording. The analysis markers are frequency and time labels on the X and Y-axis of the images. The markers give a necessary frame of reference and are especially useful when resizing the window, adjusting the printing rate, or configuring the logarithmic frequency distribution of the spectrogram.
Further, it's possible to add a grid structure over the images, called a Display Grid. The size and visibility of the display grid can be set through the Grid Size and View Display Grid options in the menubar. To accommodate the analysis markers and grid function, AVA also features clickpoint data retrieval. By clicking on the spectrogram, users can retrieve sound energy/amplitude data at specific frequencies for a more detailed inspection of the spectral audio content.
I first learned about clickpoint data retrieval in this paper by Jean-Francois Charles called A Tutorial on Spectral Sound Processing Using Max/MSP and Jitter. I used Jean-Francois' algorithms as the basis for my implementation.
Image Layering
To add to the visual and real-time capabilities of AVA, I introduced additional display options for image layering. With image layering, users can view the spectral images in different configurations in the display window. The layering options include the ability to view the images individually (only audio or only video), in a cake-like fashion (one in on top of the other), or layered (one is over the other).
Export Options
The final images you create in the AVA display window can be exported via the export options in the menubar. The available formats are JPEG, TIFF (lossless), and PNG.
Unfortunately, the image resolution cannot be customized due to several processing constraints. The maximum export image resolution is 1024x720, and it will decrease based on the printing rate you use.
Download Link and Resources
AudioVideoAnalysis is open source and available on both OSX and WIN. The software can be downloaded from the FourMS GitHub page. If you want to contribute, you are free to do so. Simply fork the AudioVideoAnalysis repo, and make a pull request for us to review.
-
Charles, Jean-Francois (2008). A Tutorial on Spectral Sound Processing Using Max/Msp and Jitter. MIT Press journals. Available at: https://www.mitpressjournals.org/doi/pdf/10.1162/comj.2008.32.3.87
-
Jensenius, Alexander Refsum (2005). Developing Tools for Studying Musical Gestures within the Max/MSP/Jitter Environment. Proceedings of the International Computer Music Conference, p. 282-285. Available at: https://www.duo.uio.no/handle/10852/26907
-
AudioVideoAnalysis was also acknowledged by Cycling74 (maxMSP creators) on their official homepage.